I. Context and objectives of the workshop
As part of its activities, the Network of Sahel Universities for Resilience (REUNIR), with the support of the PAM, organized a 10 au 22 octobre 2022, at the Abdou Moumouni University of Niamey (Niger) in the premises of the École Normale Supérieure, a training workshop for teacher-researchers, future trainers on the modules of the 3PA approach. The workshop brought together 19 teacher-researchers from six universities from five REUNIR member countries. These are the Nazi BONI University (Burkina Faso), the Gaston Berger University (Senegal), the Abdou MOUMOUNI University (Niger), the Dan Dicko DANKOULODO University of Maradi (Niger), the University of N 'Djamena (Chad) and the Rural Polytechnic Institute of Training and Applied Research (Mali) (see list of participants in appendix 1).
This activity is part of the policy of strengthening the capacities of teacher-researchers in the 3PA tools already integrated into the curricula of five REUNIR member universities. It follows the recommendations of the REUNIR workshop held from May 30 to June 1, 2022 in Senegal. It completes a series of workshops and training carried out in person and online on the same tools.
Le présent atelier de renforcement des capacités des enseignants-chercheurs des universités vise à les outiller non seulement sur la compréhension des concepts mais également l’appropriation de la démarche méthodologique et technique de réalisation et de mise en œuvre de ces outils 3PA.
L’objectif général de l’atelier était de renforcer les compétences des universitaires sur les outils 3PA et de disposer d’une masse critique de formateurs dans les pays du Sahel. De façon spécifique, cette formation a porté sur les concepts de base des outils 3PA (AIC, PSME et PCP), les méthodologies de conception, de réalisation et de mise en œuvre des outils 3PA, les éléments clés pour l’analyse et l’interprétation des résultats et des études de cas pratiques avec des données réelles.
II. Process
II.1. Opening speech
In the absence of the Executive Secretary of REUNIR, Professor Toguyeni, for administrative reasons, the opening remarks of the workshop were delivered by Dr Sitou LAWALI, responsible for communications and external relations of REUNIR. He welcomed the participants and reminded that this training workshop is part of capacity building for teacher-researchers on the 3PA modules. He then stressed that the different teachers who will be trained during these workshops will be able to deliver this module at all levels.
After these welcoming words, Mr. Adamou Ounteni ISSAKA from the WFP West and Central Africa Regional Office, welcomed the initiative of this workshop which follows the recommendations of the Saly workshop organized by REUNIR in Senegal on May 30 to June 1, 2022. He stressed that this training is an opportunity for teacher-researchers and should be extended to other regions, particularly in Central and Eastern Africa, by teachers from the REUNIR network. He concluded his speech by asking the participants to capitalize on the knowledge that will be shared but also to be future relays for the training of students and teacher-researchers.
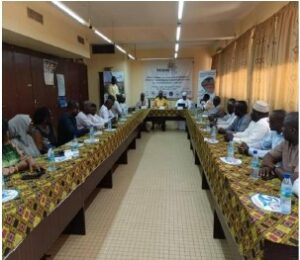
Following the speeches, a round table discussion was held to present the participants and the workshop agenda. The attendance list is attached as an appendix. The workshop was organized into three modules taught by two WFP trainers: (i) Integrated Context Analysis (IAC) taught by Abdoulaye NDIAYE from the WFP regional office in Dakar, (ii) Seasonal Planning based on Means (PSME) and (iii) Participatory Community Planning (PCP) by Mr. Ibrahim Abdoulaye ISSAKA of WFP Niger.
It should be noted that the Rector of the University, Abdou Moumouni, insisted on making the trip on the 4th day (présence effective of all the participants) of the training to welcome all participants and salute the efforts made by REUNIR and the WFP which financed the training. He stressed that the 3PAs are very important decision-making tools for our different countries and that their integration into curricula constitutes a very good approach to popularize them.
II.2. Training on Integrated Context Analysis (ICA)
The training on AIC took place over 7 days, from Monday October 10 to 17, 2022 from 9 a.m. to 5 p.m., and concerned several subjects: (i) introduction and principles on AIC, (ii) the data required for do the work, (iii the analysis of food security; (iv) the different natural shocks to consider (flooding and drought); (v) the additional layers related to the aggravating factors with a focus on land degradation. For all the topics covered, the trainer presented the principles and definitions, required data, data acquisition, data processing and data analysis.
The AIC is based on the principles of analyzing historical trends of different themes, the results of which are superimposed to identify areas of overlap. It is based on two main factors or main layers: trends in food insecurity and the main natural shocks (droughts and floods, landslides, etc.). This analysis helps understand the history and identify areas where short, medium and long term programming efforts may be necessary. Beyond the main AIC factors, additional layers related to topics relevant to program strategies (e.g. land degradation, nutrition, conflict) can be overlaid to support further strategic adjustments.
During the training, for each layer of analysis, the period of analysis, the sources (state structures or global data download platforms) relevant for data collection were explored as well as the administrative level concerned. Table 1 gives details for each layer of the AIC.
Table 1: the different main and additional layers used in Integrated Context Analysis (ICA)
| Layer | Thematic | Période | Indicator | Sources | Niveau administrative |
| Main | Food Safety | Last 5 years | CARI | WFP- gvt | Department |
| Main | Food Safety | Last 5 years | SCA | WFP- gvt | Department |
| Main | Food Safety | Last 5 years | CH | CILSS | Department |
| Main | Flood | 30 years and over | Frequency | UNEP/GAR | Global |
| Main | Drought | 30 years and over | Frequency | NASA/CHIRPS(RFE) | Global |
| Additional | Land degradation | 10-15 and up | Land Occupation and Use/Ecological Change | NASA/MODIS | Global |
| Additional | Population | Last year | Density/Total population | Gvt/LandScan/Wor ldPop | Global/Department |
| Additional | Nutrition | Last 5 years | MAG/MCG | SMART | Department |
| Additional | Conflicts | Last 5 years/Last 12 months/Last 6 months | Number of incidents and number of deaths | ACLEDDATA.COM | Department |
For data processing and analysis, Microsoft Excel and Esri ArcGIS 10.8 software were used.
II.2.1 FOOD SECURITY ANALYSIS
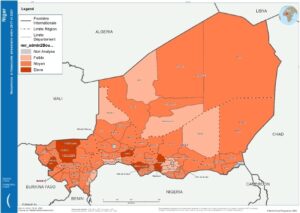
For food security, the trainer provided a template which helps to estimate a certain number of indicators to facilitate the analysis. This template makes it possible to determine by department the populations: (i) vulnerable for long-term planning; (ii) the most vulnerable by area and (iii) additional populations in the event of shocks. Arcgis software was used to complete the analysis and produce the food security map.
For all the analyzes carried out during the training, the case of Niger was taken as an example study and the practical work of the participants focused exclusively on this case.
Figure 1 gives a map of food insecurity in Niger produced by a participant
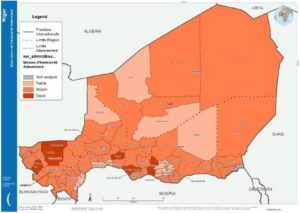
Figure1: Example of food insecurity map
After analyzing food security, the trainer addressed natural shocks (flooding and drought). For the analysis of these layers, the Arcgis software was used for the classification of the different zones according to the theme studied as well as the crossing of the different layers to produce a summary map.
II..2.2 ANALYSIS OF FLOOD AND DROUGHT RISKS
For this theme, data on flood frequencies produced by UNEP/GAR were used. This data can be downloaded from the link https://wesr.unepgrid.ch/?project=MX-XVK-HPH-OGN-HVE-GGN&language=en .The participants manipulated data on flood frequencies corresponding to the country of Niger and provided by the trainer. For the development and analysis of this layer, a complete guide containing all the steps of the analysis was provided to the participants.
For the drought risk analysis, the data provided by the trainer was used. As with the flood analysis, participants followed the guide provided for this purpose to do the work. Figures 2 and 3 provide examples of flood and drought risk maps respectively.
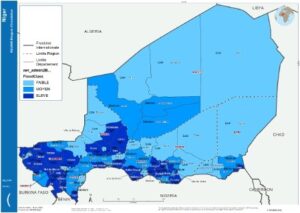
Figure 2: Example of flood risk map
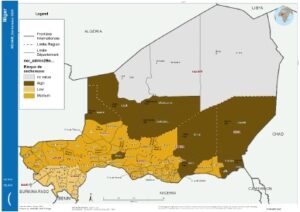
Figure 3: example of a drought risk map
II.2.3 CREATING MAPS OF AIC ZONES
Further analysis was carried out based on crossing the main layers. This crossing allowed participants to create vulnerability overlap maps (Zone 1 A, Zone 1 B, Zone 2 A, Zone 2 B, Zone 3 A, Zone 3 B, Zone 4 A, Zone 4 B and Zone 5) which make it possible to know the level of severity of exposure of populations to shocks for better guidance in the development of resilience assistance programs. Figure 4 gives an example made by a participant.
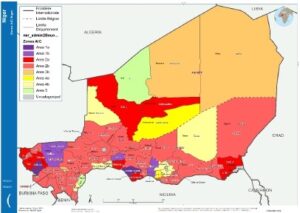
Figure 4: example of AIC area map
II.2.4 ANALYSIS OF LAND DEGRADATION
This part was covered by the trainer using the land degradation analysis package with the ecological change approach and basic land cover and use data from MODIS from 2001 to 2021. Practical exercises The design of the land degradation maps first consisted of downloading land cover data from the NASA Earth data website (https://search.earthdata.nasa.gov) and data preparation using ArcGIS software. This followed a generalization of MODIS MCD12Q1 land cover classes and a comparison of time 1 (2006-2011) and time 2 (2016-2021). A calculation of statistics on positive, negative values and no change was then carried out to then calculate the percentage of the surface area affected by the change in land cover.
II.2.5 DISCUSSIONS AND RECOMMENDATIONS
The discussions during the AIC training focused on:
- the availability of data : the participants raised the problem of accessibility to certain data for producing the various maps. To this end, they recommended finding a mechanism to work directly with technical services and WFP to have certain data;
- the possibility to use THE software QGIS Who is a software free : ArcGIS software is paid and requires the purchase of a license annually. However, REUNIR member universities do not always have the means to acquire this tool. To this end, participants recommend exploring the possibility of migrating to QGIS for AIC analysis.
- the guides of realization of maps : It has been found that some guides are not up to date. To this end, the participants recommend updating the various guides used.
- the need to have a support of course single for all the universities : It was recommended to work on a consensus manual. At the end of the AIC training, all participants congratulated and thanked the trainer for the success of the training, his commitment and his availability.
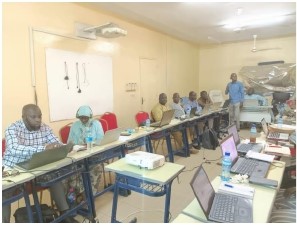
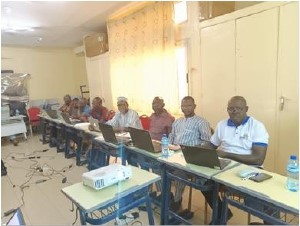
Picture 1 : vue de la salle de formation avec les participants et le formateur
Following this training, the remaining four (4) days of the training were devoted to Livelihood-Based Seasonal Planning (LSME) and Participatory Community Planning (PCP).
II.3 Training on Livelihood-Based Seasonal Planning (PSME)
This training took place over two days, October 19 and 20, 2022, and was led by Mr. Ibrahim Abdoulaye ISSAKA from the PAM Niger office. Before the presentation of the fundamentals of PSME, the context of the Sahel was defined so that participants had an overview of the relationship between AIC and PSME but also on the usefulness of the PSME tool in the Sahelian context.
PSME is defined as a participatory approach at the regional level, responding to the important concerns of strengthening operational coordination and developing new partnerships for resilience. It is made up of a seasonal calendar which subdivides the year into normal and crisis periods in order to identify the significant changes that take place in the event of shocks and to identify the best adaptation strategies for populations in the event of shocks. It also includes an identification of the main programmatic phases (investment phase, preparation phase, protection phase) and activities by year, season, livelihood, building partnerships, vulnerable groups, gender.
After this definition of PSME, the guiding principles of the tool were discussed. He presented the products of a PSME workshop. It is mainly an Excel file including calendars and multi-year multi-sector planning (main source of information), followed by a report for a more detailed explanation. He also stressed that the results obtained can be presented in the form of posters. This was followed by the presentation of a PSME carried out in Mauritania (Assaba Region) in a predominantly agropastoral area. The trainer addressed questions relating to filling out the PSME Excel file. He returned to the method of calculating and forecasting shocks.
He then successively addressed the seasonal calendar for a typical year and a bad year, the identification of programmatic entry points and vulnerability profiles in the face of shocks, the community action plan as well as the system for monitoring and evaluating activities. .
II.4 Training on Participatory Community Planning
The third and final module of the workshop focused on Participatory Community Planning (PCP). The trainer immediately defined the PCP as a participatory diagnosis and planning exercise at the community level which aims to improve the description and understanding of the land of a village or a cluster of villages. It consists of carrying out a concrete, multi-year community action plan over 3 or even 5 years and initiating a series of exchanges with the community which will continue over time.
The training then focused on the three phases of carrying out a PCP, namely:
- The preparation phase;
- The PCP workshop phase:
- The PCP workshop phase:
The first phase, preparation is very important and can take one to two day(s) and allows consultation and mobilization of local authorities; engage in dialogue with partners present locally. The second stage concerns the realization of the PCP workshop which lasts four days and concerns the main stages of any PCP workshop; The last step is the production of the PCP report which lasts one day. At this level, there is the return of the action plan to the communities in assembly at the Center village; finalize the report on the site before returning to the capital of the municipality and have the mayor sign it and discuss the next steps with the stakeholders concerned. The trainer ended his presentation with a practical example of a PCP carried out, the methodology applied, etc.
To end the training, the trainer unfolded the outline of the PCP report which he explained page by page to the teacher-researchers. He insisted on how to carry out the community action plan and its monitoring.
II.5. Closing of the workshop
The closing ceremony of the workshop was marked by the presence of the Minister of Higher Education and Research of Niger and the Executive Secretary. It consisted of four interventions: that of the Rector of the University Abdou Moumouni, the words of the PAM representative, the speech of the Executive Secretary of REUNIR and finally the closing speech of the Minister of Higher Education and Scientific Research.
- In his speech, the Rector of Abdou Moumouni University, Professor Mahamadou SAIDOU, noted that REUNIR is a young organization but which already has a lot of achievements thanks to the dynamism of the team. He ended his remarks by inviting participants to make good use of the training to advance REUNIR and member universities.
- Mr. Adamou Ounteni ISSAKA, Senior Advisor for Regional Policies and Programs at the WFP Regional Office in Dakar, welcomed the presence of the Minister of Higher Education at the closing ceremony, which once again shows the commitment of the highest authorities to the smooth running of REUNIR’s activities. He stressed that his organization has two main objectives, namely save lives during emergencies by bringing food and to change lives by supporting vulnerable populations to not always ask for food. He clarified that knowledge and skills are the pillars of development. To this end, this capacity building workshop for teachers is relevant.
- The Executive Secretary of REUNIR, Professor Aboubacar TOGUYENI, after thanking the Minister of Higher Education for his presence as well as the PAM for financing this workshop, recalled the context of the creation of the network, its objectives and actions already carried out . He welcomed the good organization of the workshop and said he was very proud of the conduct of the teacher-researchers throughout the training. He called on teacher-researchers to take ownership of these tools and to be relays for the training of teacher-researchers and students at their respective universities. He ended his speech by congratulating his colleagues and thanking the PAM and the Minister of Higher Education and Research.
- Finally, the Minister of Higher Education and Research, Dr Mamoudou DJIBO, welcomed the holding of this workshop in Niger and noted the importance of this activity in strengthening the capacities of teacher-researchers. He welcomed the federation of universities from five Sahel countries to work together for the well-being of the communities. The minister urged the network to continue this good work before declaring the training of trainers workshop on 3PA tools closed.
At the end of the closing ceremony, the authorities handed out certificates to the participants.
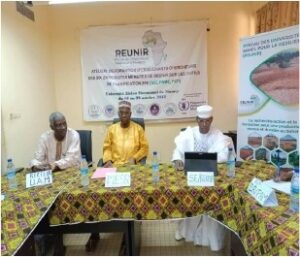
Picture 3 : Closing ceremony of the workshop placed under the presidency of the Minister of Higher Education and Research.

Picture 4 Presentation of a certificate by the Minister of Higher Education to the representative of the WFP

Photo 5 : Presentation of the certificate by the Rector of the University of Niamey to a participant from Chad
III. RECOMMENDATIONS
At the end of this training of trainers workshop, the participants made the following recommendations:
- A the place of WFP :
- the organization of practical workshops in the field with the participation of teachers, students and local stakeholders with a view to organizing PSME and PCP sessions in a participatory manner;
- exploring the possibility of migrating to QGIS for AIC analysis.
- A the place of REUNIR:
- the development of a training manual on 3PA for all universities;
- the organization in the universities concerned of training on how to use the ArcGis software;
- A the place of REUNIR and of WFP
- updating the various guides used for training on 3PA tools.
Appendix 2: DAILY REPORTS
Report 1: BURKINA FASO DELEGATION
Introduction
From October 10 to 22, 2022, the training workshop on 3PA modules was held at the Abdou Moumouni University in Niamey (Niger) on the premises of the École Normale Supérieure / Professional Master in Design and Management of Pedagogical Innovations. It brought together 21 teachers from six universities from five countries of the Sahel Universities Network for Resilience (REUNIR) (§List of participants). The objectives of this workshop were:
- General objective:
The general objective of the workshop is to strengthen the skills of universities on 3PA tools and to have a critical mass of trainers in the Sahel countries.
- Specific objectives :
Specifically, this training covers:
-
- global notions of resilience;
- the basic concepts of 3PA tools (AIC, PSME and PCP);
- methodologies for designing, creating and implementing 3PA tools;
- the steps and tools for carrying out AIC, PSME and PCP;
- the key elements for the analysis and interpretation of the results;
- practical case studies with real data.
1. Day 1 of the workshop (October 10, 2022)
After welcoming and settling in the participants, Dr Sitou LAWALI gave a welcome speech to the participants in this training workshop which is held as part of capacity building for teachers in the 3PA modules. He then announced that the various teachers who will be trained during this workshop will be trainers of trainers and students, not only in their respective universities, but everywhere in the network of universities where necessary.
After this welcome word, Colonel/Major Ounténi Issiaka Adamou taking the floor, welcomed the initiative of this workshop, born from the reflection of the initiative to create REUNIR. He also hoped that the network and these training courses could expand to other regions of Africa, such as the French-speaking Central and Eastern regions. Before concluding his speech, he urged the participants to listen attentively and follow the training, as they must act as relays to the target groups. His remarks ended with the wish to see this training workshop produce competent teachers in the 3PA modules.
Before the start of the training itself, a round table was held to allow participants to introduce themselves. The trainer, Dr Abdoulaye Ndiaye, began this first day with a presentation of the timeline which extends over seven days and concerns Integrated Context Analysis (AIC). The first presentation therefore concerned an introduction to AIC. The second presentation concerned the data required for the AIC.
A recommendation to the PAM emerged from this first day: facilitate the acquisition of licenses for the mapping software (ARCGIS), used as part of the execution of the 3PA modules. Failing this, it would be advisable to migrate to open source and free software like (QGIS).
2. Day 2 of the workshop (October 11, 2022)
The training resumed with a reminder of the principles of AIC, followed by the presentation of the types of data that are to be considered (national or modeled) and finally by the unfolding of the range of differences available sources and standards used. Inventory models were presented followed by a practical exercise on the Templates permettant de capturer par l’IAC la récurrence de l’insécurité alimentaire au niveau pays « ner_admin2_Food security recurrence 2014 – 2021_20221011exo » et « ICA_Food_Security_Analysis_Template_-_EN exo » aussi des exercices d’épurations de données ont été pratiquées sur les fiches afin des importer sur ArcGIS.
As a recommendation, the trainer invited the learners to install the ArcGIS software which should be used for mapping the recurrence of food insecurity.
Learners further suggested the provision of mapping software (especially Free).
Report 2: MALI DELEGATION
Diary
- Presentationand discussions on AIC tools (continued)
- Welcome officials from Abdou Moumouni University and the WFP
- Challenges
Integrated context analysis (AIC) is one of the tools of the 3PA approach based on the use of geospatial information generally on a national or departmental scale by governments and their partners to identify the geographical areas most vulnerable to insecurity. food and natural shocks in order to define the most appropriate programmatic strategies for these areas. The training on October 12 and 13, 2022, organized by the REUNIR network in partnership with the PAM, focused mainly on the search for data useful to AIC as well as the methods required for their preparation and analysis.
1. Presentation and discussions on AIC tools
The training sessions over the two days began around 9 a.m. The trainer, Mr. Abdoulaye Ndiaye, before continuing with the technical manipulations in Excel and ArcGIS, recalled that two main categories of geographic data are used in the AIC:
- Core data or core layers that bring together information on food security/insecurity, major shocks like floods or drought;
- Additional layers or aggravating factors which are, among others, land degradation (change of cover, erosion), populations and conflicts.
Together with participants from the five countries (Burkina Faso, Mali, Niger, Senegal and Chad), the trainer recommended the following details regarding the data required for the IA.
| LAYER | THEMATIC | PERIODE | INDICATOR | SOURCES | ADMINISTRATIVE LEVEL |
| Main | Food Safety | Last 5 years | CARI | WFP- gvt | Department |
| Main | Food Safety | Last 5 years | SCA | WFP- gvt | Department |
| Main | Food Safety | Last 5 years | CH | CILSS | Department |
| Additional | Flood | 30 years and over | Frequency | UNEP/GAR | Global |
| Main | Drought | 30 years and over | Frequency | NASA/CHIRPS(RFE) | Global |
| Additional | Degradation des terres | 10-15 and up | Land occupation and use/Ecological changes | NASA/MODIS | Global |
| Additional | Population | Last year | Density/Total Population | Gvt/LandScan/WorldPop | Global/Department |
| Additional | Nutrition | Last 5 years | MAG/MCG | SMART | Department |
| Additional | Conflicts | 5 dernières années/12 derniers mois/6 derniers mois | Number of incidents and number of deaths | ACLEDDATA.COM | Department |
Concerning data preparation and processing operations, Microsoft Excel (Excel) and Esri ArcGIS (ArcMap) software were used. Excel to prepare food safety data based on a template (pre-programmed spreadsheet) shared by the trainer. The template makes it possible to estimate a certain number of indicators to help plan interventions. These indicators include:
- The class marking the situation of food insecure populations by area
- Vulnerable populations for long-term planning
- Most vulnerable populations by area
- Additional populations in the event of shocks
As case studies, 2 maps for the country of Niger were developed using primary and additional data all provided by the trainer, these are:
1- The map establishing the areas of recurrence of food insecurity
2- The map of flood risk areas
1.1. Food insecurity recurrence map
For its development, data from the last 5 years on Niger resulting from the CARI (Consolidated Food Security Indicator Approach) developed by the World Food Program were used. Based on the Excel template proposed by the trainer, the participants were able to estimate the indicators relating to food security for the different regions of the country. These indicators defined in Excel were able to be transferred to a geographic data layer on the level 2 administrative boundaries of Niger in shapefile format using the join functionalities offered. by ArcMAP GIS software. This join operation would prove to be crucial in the process of creating this map. It allows, by using a unique key (e.g. Region Code) which exists in both Excel and GIS files, to transfer information from the first file to the second without error. Once the indicator data is retrieved in the ArcMAP space, a second template is used for easy layout of the map with all the required elements (north orientation, legend, scale, WFP logos, data sources, title). The template for creating the card is also provided by the trainer. To facilitate and standardize the choice of colors for geographic features, aStylefile is provided and imported into the ArcMAP working environment. An example of cards produced during this training using the layout template is illustrated below with the different classes relating to the recurrence of food insecurity.
1.2. Map of flood risk areas
Flood frequency data produced by UNEP/GAR were used. This data can be downloaded from the following link https://wesr.unepgrid.ch/?project=MX-XVK-HPH-OGN-HVE-GGN&language=en.
Participants manipulated data on flood frequencies corresponding to the country of Niger and provided by the trainer. It is a GIS file in raster (image) format. For the development of this flood map, a comprehensive guide was provided to participants. This guide in English contains the different steps to follow to:
- Define the coordinate system of GIS layers. The overallWGS1984has been associated with the raster image.
- Projeter les couches de données pour permettre les calculs de superficie. Puisque le Niger couvre plusieurs zones UTM, le formateur a proposé d’utiliser un système global de projection nommé Africa_Albers_Equal_Area_Conic.
- Calculate statistics using theZonalStatisticscommand and export the results into a database in tabular form .
- Associate the table data with the GIS file containing the administrative regions of Niger using the join procedure described previously.Associate the table data with the GIS file containing the administrative regions of Niger using the join procedure described previously.
- Reclassify the data to define the different flood classes.
The training should continue with operations to layout the coach on flood risks using the template provided for this purpose. For the two days covered in this report, training sessions stopped around 5 p.m.
2. Reception of officials from Abdou Moumounou University and PAM
The Rector of Abdou Moumouni University (UAM) in Niamey, the Regional Resilience Advisor of the Regional Office of the WFP based in Dakar, Senegal, Mr. Adamou, the focal point of the REUNIR network in Niger, the coordinator of the Professional Master's in Design and Management of Pedagogical Innovations whose premises hosted the training. The moderator of the ceremony was Professor Sitou from the REUNIR network. After a round of individual presentations, the Rector of UAM and Mr. Adamou from WFP spoke successively.
The WFP representative emphasized that the main objective of this type of training for teacher-researchers is to strengthen the capacities of Sahelian universities in the 3PA tools developed by WFP in the field of resilience. These tools include the CFA (Contextualized Integrated Analysis), the SLMP (Seasonal Livelihoods Programming Process), and the CPP (Community Participatory Planning). The CFA helps identify priority geographical areas for interventions, the SLMP identifies appropriate programs and partners, and the CPP ensures that the plans developed will be tailored to local priorities. The ultimate goal is to support governments in their country's policies and management. Mr. Adamou highlighted that WFP relies heavily on the participants to take the lead in training on these tools. Many other projects are in the works to achieve this goal.
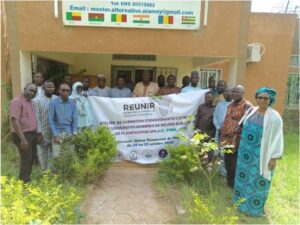
As for the Rector of UAM, he urged the participants, whom he referred to as colleagues, to take courage and, above all, to capitalize on the concepts learned during the training workshop. He commended the efforts made by the organizers and the partner who funded the training. According to him, we are in action research, and the 3PA tools that are the focus of this workshop are very important decision-making tools for our respective countries. Before the delegation bid farewell to the session, a group photo was taken in front of the premises of the Professional Master's in Design and Management of Pedagogical Innovations.
3. Challenges
Basic knowledge of geographic data and GIS (Geographic Information System) is required for a better assimilation of the concepts of the CFA. Additionally, the ArcMap GIS software, which is at the core of this training, is proprietary and paid. This can be time-consuming and pose challenges for the transfer of acquired knowledge in the university setting.
Report 3: NIGER DELEGATION
Day 5 of the workshop
The morning began with the usual greetings. The trainer gave a reminder of the previous day. These reminders concerned theactivities conducted on the mapping of flood risk zonesin particular the preparation of data; the creation of statistical variables and the processing of data percentage of areas at risk of flooding.
1. Activities of the day
1. 1. Classify the field (column): PercFLClas into three classes. The procedure is as follows:
a) right-click/properties on the layer (shapefile);
b) symbology/Quantities/Graduatecolor;
c) Classify/Naturalbreaks class/ 3
1. 2. Reclassification of areas at risk of flooding (for the steps to follow, see the guide on page 13).
NB: if an error message is displayed, replace the comma «,» with the period “.”the “Pre-LogicScriptCode:” formula.
1. 3. Classification of maximum flood frequencies
a) We must first define the “ Maximum frequency offloods” (for the steps to follow, refer to the guide on pages 13 to 14).
b) We then proceed with the classification (for the steps to follow, refer to the guide on page 14).
4.1. Combining flood frequency with percentage of surface at flood hazard
a) Create a short integer column
b) Then, classify
c) c)finally reclassify the flood risk score (for the steps to follow, see the guide on pages 15 and 16).
1. 5. Mapping the flood risk score
(For the steps to follow, see the guide, point 1. 1. 8 on page 16).
1. 6. Determination of drought risk
a) preparation of data to be used in the exercise. These are the shapefiles shared by the trainer.
b) concern was raised about access to data and methodology for applications in the context of courses to be taught in our respective universities. It was noted that certain data are directly accessible (e.g. data) on specialized sites. On the other hand, certain disaggregated data are only accessible from the PAM. So, should we request this data from the WFP for the update?
After the discussions, a presentation on the risk of drought followed. Based on a (shared) guide, it focused on possible indicators of drought. the trainer focused on the “poor growing seasons”.
2. Practical exercises
Creation of the drought exposure variable
a) Creation of the Zonal Statistics as Table: (see guide on page 3, for steps to follow);
b) Creating the join of fields: (see the guide on page 13, for the steps to follow);
c) Add a new column of type Long Integer and name it: NPGS
the suite of activités is à finaliser, sur la base of guide, comme exercice of maison and à présenter THE lendemain.
Day 6 of the workshop
The morning was devoted to the rest of the mapping. After that, the materials needed to begin the combination of shocks were shared with the participants by the trainer. A ppt presentation on natural shocks was presented before starting the practical exercises.
I. Ranking of the number of bad weight seasons
At this level, to integrate the drought data with the reclassified rapid shock data, we must classify the NPGS values into 3 classes. The final step was to map the drought risk score.
After this drought risk mapping, we moved on to part 5 relating to the categories and domains of the ICA. Once the different natural shocks have been combined into a single danger score ranging from 1 to 3 (low to high), they can be combined with food insecurity data to assign ICA zones and categories to units of analysis. To do this, we added 2 new text fields, one namedICA_Areasand the otherICA_Categ.
On the ICA_Areas field header, the Calculator field has been selected to assign the appropriate ICA area to each district using the following expression:
Pre-logic script code:
def Reclass(NS_Class, FI_Class) :

          si (NS_Class == 1 et FI_Class == 1):

                   retour « Zone 5 »

          elif (NS_Class == 2 et FI_Class == 1):

                   retour « Zone 4b »

          elif (NS_Class == 3 et FI_Class == 1):

                   retour « Zone 4a »

          elif (NS_Class == 1 et FI_Class == 2):

                   retourner « Zone 3b »

          elif (NS_Class == 1 et FI_Class == 3):

                   retour « Zone 3a »

          elif (NS_Class == 2 et FI_Class == 2):

                   retourner « Zone 2b »

          elif (NS_Class == 3 et FI_Class == 2):

                   retour « Zone 2a »

          elif (NS_Class == 2 et FI_Class == 3):

                   retourner « Zone 1b »

          elif (NS_Class == 3 et FI_Class == 3):

                   retour « Zone 1a »

          autre:

                   retour « Non classifié(e)
ICA_Areas =
Reclasser(! NS_Class!, !FI_Class!)
II. Catégorisation ICA
Thereafter, the steps from the previous section were repeated, but this time classifying the districts based on their category. So, on the field headerICA_Categthe Calculator field was selected to assign the appropriate ICA category to each district using the following expression:
Pre-logic script code:
def Reclass(ICA_Areas):

     si ICA_Areas == 'Zone 5':

           retour « Catégorie 5 »

     elif (ICA_Areas == 'Zone 4a' ou ICA_Areas == 'Zone 4b'):

           retour « Catégorie 4 »

     elif (ICA_Areas == 'Zone 3a' ou ICA_Areas == 'Zone 3b'):

           retourner « Catégorie 3 »

     elif (ICA_Areas == 'Zone 2a' ou ICA_Areas == 'Zone 2b'):

           retour « Catégorie 2 »

     elif (ICA_Areas == 'Zone 1a' ou ICA_Areas == 'Zone 1b'):

           retour « Catégorie 1 »

     autre:

           retour « Non classifié(e)
ICA_Categ =
Reclasser(! ICA_Areas!)
The end of the day consists of mapping the areas and categories.
Report 4: SENEGAL DELEGATION
1. Day 7 of the workshop
The trainer, Mr. Abdoulaye NDIAYE, recalled the work carried out so far. This involves analyzing food security to produce thematic maps and see trends to highlight the level of recurrence of food insecurity. These thematic maps aim to highlight areas at risk as well as populations who may face food insecurity in the event of shocks. To do this, the main layers linked to flooding and drought were used to create thematic maps. A more in-depth analysis was carried out on the basis of these thematic maps by crossing two natural shocks (floods and drought). This crossing allowed participants to create vulnerability overlap maps (Zone 1 A, Zone 1 B, Zone 2 A, Zone 2 B, Zone 3 A, Zone 3 B, Zone 4 A, Zone 4 B and Zone 5) which make it possible to know the level of severity of exposure of populations to shocks for better guidance in the development of resilience assistance programs. In addition to the main layers, the trainer recalled that the additional layers are relevant layers which should help to better understand the resilience situation. However, it is important to remember that a layer, although an additional layer, can be reclassified as a main layer, if its impact on the livelihoods and resilience of communities is considered considerable.
Given the growing concerns about land degradation in the Sahel, WFP has included the production of maps on land degradation as part of the training of trainers on 3PA tools. Indeed, knowledge of the level of land degradation is necessary to support decision-making and planning of government actions. Thus, the package concerning the guides for analyzing land degradation with the ecological change approach and the basic land occupation and use data from MODIS from 2001 to 2021 were given to the participants. This was followed by a presentation on the aggravating factors: land degradation and malnutrition (changes in land cover and propensity for erosion). During this presentation, participants recalled the need to have a holistic approach when interpreting land degradation maps because of the diversity of interpretations of the term “degradation”. Indeed, any change in land use is often considered as “degradation” by foresters (environmentalists) while this change can be considered as a change of use by agronomists.
The practical land degradation map design exercises first consisted of downloading land cover data from the NASA Earth data website (https://search.earthdata.nasa.gov) and data preparation using ArcGIS software. This followed a generalization of MODIS MCD12Q1 land cover classes and a comparison of time 1 (2006-2011) and time 2 (2016-2021). A calculation of statistics on positive, negative values and no change was then carried out to then calculate the percentage of the surface area affected by the change in land cover.
Closing the AIC training of trainers, the trainer thanked the participants for their active participation and their suggestions that will help improve the AIC module. He recalled that the latter is based on existing methods to highlight the level of vulnerability of populations. We are talking about a contextual analysis which is therefore based on historical data and not on spontaneous data. It is also based on a three-level approach and must remain a democratic process in the sense that it promotes the participation of all people impacted and involved in the process of managing food insecurity. In addition to being democratic, the AIC must be an inclusive process (populations, programs, academics) to ensure that all concerns are taken into account to better define strategic directions.
2. Day 8 of the workshop
Day 8 corresponds to the start of the training on Seasonal Programming based on Livelihoods (PSME) given by Mr. Ibrahim ABDOULAYE ISSAKA, Program Policy Officer, Planning-Resilience at the UN World Food Program office in Niamey – Niger. After a presentation by the trainer, Dr. Sitou LAWALI recalled the usefulness of PSME to better guide the knowledge acquired during AIC training. Colonel/Major Ounténi Issiaka ADAMOU, Representative of the Regional Office based in Dakar, also took this opportunity to recall the two major objectives of the WFP: “Saving lives” for food and nutritional security and “Changing lives”. He indicated that since 2015, the notion of changing, in addition to saving, lives was initiated by the WFP. This new paradigm demonstrates the WFP's desire to move from aid to food assistance with the aim of promoting the participation of populations in their own resilience. The importance of mastering the tools within REUNIR member universities which have integrated the 3PA modules into their training was also underlined by Mr. ADAMOU. Finally, he specified that the participation of teacher-researchers from the different universities of the REUNIR network in PAM programs can help to disseminate and improve the 3PA approach in the Sahel.
After this introduction, the trainer proceeded with a presentation of the program on the PSME and PCP tools and the corresponding case studies for a better understanding of these tools. Before the presentation of the fundamentals of PSME, the context of the Sahel was defined so that participants had an overview of the relationship between AIC and PSME but also on the usefulness of the PSME tool in the Sahelian context. Indeed, the Sahel is characterized by a recurrence of shocks and a multitude of challenges that weaken the resilience of communities. Added to this is the demographic increase which has led to an increase in the needs of populations which can no longer be met by stagnant or even decreasing production. Armed conflicts, political unrest and institutional instability also cause population displacements, which lead to a decline in production and the resilience of populations due to limited means of production. All of these factors, characteristic of the Sahel, constitute major challenges to the food and nutritional security of populations.
Faced with these numerous shocks which destabilize the resilience of the Sahel, the WFP has implemented a resilience approach which includes three tools at different levels. This is the national level which uses the AIC to define strategic priorities and geographic targeting; from the sub-regional level using PSME to strengthen operational coordination of partners and joint resilience programming; and finally the local level which is based on the PCP to define priority activities and build resilience at the community level. Despite these three levels of intervention, it is important to work in synergy with all actors because no actor taken individually can meet the challenge of resilience. A synergy of the actions of NGOs and technical services, in addition to leadership from the Sahel States, was therefore proposed for cohesion of interventions by all partners and better knowledge of the livelihoods and assets of the communities.
Seasonal Programming based on Livelihoods (PSME) is defined as a participatory approach at the regional level responding to the important concerns of strengthening operational coordination and developing new partnerships for resilience. By bringing together communities, authorities, technical services, and partners, it offers a favorable planning framework based on the concerns of the different stakeholders. The PSME is made up of a seasonal calendar which subdivides the year into normal and crisis periods in order to identify the significant changes that take place in the event of shocks and to identify the best adaptation strategies for populations in the event of shocks. . It also includes an identification of the main programmatic phases (investment phase, preparation phase, protection phase) and activities by year, season, livelihood, building partnerships, vulnerable groups, gender.
After a definition of PSME, the guiding principles of the PSME tool were addressed during the training of trainers. Indeed, PSME must be participatory in order to encourage the participation of all stakeholders, particularly communities. The seasonality of farmers' concerns must be taken into account to better understand livelihoods according to the periods. In this process, it is also important to take into account all segments of the population such as men, women, the elderly, young people, etc. Due to the specificity of the years, a multi-year assessment of resilience by all sectors is recommended for a better connection between humanitarian programs and development services. In line with WFP’s approach to identifying the most vulnerable populations living in fragile ecosystems, vulnerability groups must be considered by all partners for resilience.
After a detailed presentation of PSME, the products of a PSME workshop were presented by the trainer. It is mainly an Excel file containing calendars and multi-year multi-sector planning (main source of information), followed by a report for a more detailed explanation of the observations in the Excel file. The results obtained can be presented in the form of posters. This was followed by a presentation of the PSME exercise carried out in Mauritania (Assaba Region) in a predominantly agropastoral area. The trainer addressed questions relating to filling out the PSME Excel file. The trainer returned to the method of calculating and forecasting shocks; and based on the chronology of shocks predict the recurrence of shocks and put in place shock response mechanisms.
Report 5: CHAD DELEGATION
1. Day 9 of the workshop
The day of October 19 allowed us to continue the rest of the presentation on PSME by successively addressing the seasonal calendar for a typical year and a bad year; identification of programmatic entry points and vulnerability profiles to shocks.
Seasonal calendars for a typical year and a bad year
Compared to the seasonal calendar for a typical year and a bad year, the objective is to determine the periods of the year during which populations are engaged in different activities; certain events affect their lives and livelihoods; the periods when the effects/impacts of these events are most felt. During the workshop, participants identified, discussed and agreed on the main periods and problems/difficulties. For example, for the case of Assaba, they identify:
- Livelihood groups in the Assaba region;
- Agricultural and livestock production cycles, and associated constraints;
- The main sources and income-generating activities;
- Les profils de dépenses et de crédit au sein des ménages ;
- Market information;
- Spikes in human diseases and child malnutrition;
- Lean periods;
- Periods perceived as being more or less difficult – depending on men and women, etc.
This was carried out for a “typical” year but also for a “bad” year in order to capture the differences to respond to a shock.
Is this information important for understanding household activities, the main challenges they face and existing opportunities to guide the identification of activities to implement, at what time during the year – in order to assist them more effectively. This process also makes it possible to better justify and establish the legitimacy of the activities identified, and to avoid appropriate measures; for example, programs conditioned by the work of populations which should be avoided during periods of peak agricultural activities.
Furthermore, understanding how livelihoods are affected and have adapted from a typical year to a bad year helps identify which activities should be adjusted or modified and how to i) avoid the loss of development gains due to of a crisis, and ii) identify opportunities to strengthen livelihoods and development efforts during a bad year.
How is this information used?
According to the trainer, the seasonal livelihood calendars present in a very visual way the key events and influential factors on which the programs will be aligned by including specific multi-sectoral activities adapted to the situation. Multi-year program scenarios can be established by including a sequence of typical and poor years in planning, using the shock history and trend in Section C of the report – for example, a 3-year program could include a typical year followed by a bad year and then another typical year.
This approach provides the foundation for planning, informing in advance which specific programs and activities should be temporarily expanded/scaled up or stopped/decreased or introduced, and identifying partnership opportunities allowing for more rapid implementation in cases. of choc.
Trigger and Bad Year: “Bad year” is usually triggered by “bad rainy seasons” and hot seasons.
Main adaptation strategies in the face of a shock
The food situation in the region during the lean season is characterized by the scarcity of cereals but above all by the surge in prices on local markets. During this period, populations adopted various strategies to adapt to the situation:
- Reduction of meals and consumption of food shortages;
- Decapitalization of goods and equipment;
- The movement of populations towards urban centers or towards countries in the sub-region.
Identifying programmatic entry points
It aims at the following objectives:
Use livelihood profiles and periods during which key events occur and impact livelihoods to justify programmatic entry points. Long-term programs involve taking into account protection and recovery activities in order to protect development gains and strengthen resilience. The different components of a multi-annual multi-sector program may include phases of:
- investments and strengthening livelihoods and resilience;
- preparation of households and communities to better prepare for future difficulties;
- Protection of lives, assets and livelihoods in order to preserve development gains.
Vulnerability profiles to shocks
The objectives of creating vulnerability profiles to shocks are:
Discuss the different vulnerability groups, if possible, for each type of livelihood, and provide a useful basis for planning and targeting activities. This workshop session does not aim to exhaustively describe vulnerability profiles but to initiate discussion and ensure that this aspect is taken into account in programming and other 'post-workshop' stages. ''. In addition, a more detailed description (targeting criterion) of each group (A, B, C, D) by livelihood category should be carried out and/or extracted from existing studies (e.g. economic analysis households) in order to help define priority activities and criteria for targeting vulnerable households.
Programs to strengthen livelihoods and resilience must be based on appropriate targeting, taking into account the specific needs of vulnerability groups. Some programs should be accessible to all regardless of vulnerability (e.g. access to basic social services), while others should be targeted primarily at specific vulnerable groups (e.g. free distributions targeted, etc.).
2. Day 10 of the workshop
The day of October 20 was mainly devoted to the module on Participatory Community Planning (PCP). The trainer immediately defined the PCP as: A participatory diagnosis and planning exercise at the community level which aims to improve the description and understanding of the land of a village or a cluster of villages. It consists of carrying out a concrete, multi-year community action plan over 3 or even 5 years and initiates a series of exchanges with the community which will continue over time. Then, he focused on the principles of the PCP which are, among others:
- Empower communities to take the initiative (“bottom-up” approach);
- A vector of “Empowerment” or empowerment of the most vulnerable groups and/or displaced people;
- Support and strengthen the action of local authorities;
- Connect communities to their land;
- Facilitate exchanges between communities and local technicians (decentralized STs and NGOs);
- Move forward based on existing approaches;
- Identify complementarities and build partnerships.
The trainer also focused on the three different phases of carrying out a PCP, namely:
- The preparation phase;
- The PCP workshop phase:
- The PCP workshop phase:
The first phase, preparation is very important and can take one to two day(s) and allows consultation and mobilization of local authorities; engage in dialogue with partners present locally – e.g. at the municipal level; familiarize yourself with the community through a preparatory visit and the collection of secondary information; to organize the practical and logistical aspects. The selection of participants taking into account all levels (young people, women, men, disabled people, technical services, etc.) is essential to the success of the PCP.
The second stage concerns the realization of the PCP workshop which lasts four days and concerns the major stages of any PCP workshop; review of format, jargon and focus on key sections; cross-cutting aspects such as gender, nutrition, etc.; the essential qualities of a facilitator who must have a strong voice, who listens and notes the reactions of the participants; PCP and managing expectations. During the workshop, the choice of location, facilitator, consideration of aspects linked to gender, nutrition, access to land and resources, territories and environments, protection, etc. are very important. Other tools such as the local map, the transect taking into account the toposequence and landscape units, vulnerability as well as secondary data appear very necessary in carrying out the PCP. The last step is the production of the PCP report which lasts one day. At this level, there is the return of the action plan to the communities in assembly at the Center village; finalize the report on the site before returning to the municipal capital and have the mayor sign it and discuss the next steps with the stakeholders concerned.
The trainer concluded his presentation with a practical example of a Participatory Community Planning (PCP) that was carried out, including the applied methodology, etc. A PCP should be titled 'Participatory Community Planning for Asset Creation and Additional Interventions.' Mr. Abdoulaye from WFP Niger, the trainer, went through the report framework, explaining it page by page to the teacher-researchers, up to the section on mapping. The continuation is scheduled for the next day, October 21, 2022, which is the final day of the training.
APPENDICES
Appendix 1: List of participants
| Order number | First and last name | Country | University | Phone |
| 1 | ABDOU GADO Fana | Niger | UAM | +227 74 39 00 39 |
| 2 | ALHOUSSENI Hadizatou | Niger | UAM | +227 92 41 09 20 |
| 3 | BOUREIMA Seyni | Niger | UDDM | +227 97 94 91 02 |
| 4 | BOUYO KWIN Jim Narem | Tchad | N’Djamena University | +235 66 52 96 65 |
| 5 | DEMBELE Kouloumégué | Mali | IPR/IFRA | +223 77 68 03 17 |
| 6 | DENENODJI Antoinette | Tchad | N’Djamena University | +235 66 20 67 88 |
| 7 | DIARRA Sabaké T. | Mali | IPR/IFRA | +223 78 75 66 06 |
| 8 | DIATTA André | Sénégal | Gaston Berger University | +221 77 791 64 51 |
| 9 | DIOP Lamine | Sénégal | Gaston Berger University | +221 77 220 47 44 |
| 10 | DIOUF Abdoulaye | Niger | UDDM | +227 96 99 08 45 |
| 11 | ISSAKA Adamou Ounteni. | Sénégal | PAM – RBD | +221 77 794 07 71 |
| 12 | KERE Michel | Burkina Faso | BONI Nazi University | + 226 71 71 80 29 |
| 13 | LAWALI Sitou | Niger | UDDM | +227 92 42 54 71 |
| 14 | LY Mouhamadou | Sénégal | Gaston Berger University | +221 77 749 01 65 |
| 15 | MAMAN Issoufou | Niger | FLSH/UAM | +227 97 15 38 96 |
| 16 | MOUTEDE-MADJI Vincent | Tchad | N’Djamena University | +235 66 34 89 27 |
| 17 | NDIAYE Abdoulaye | Sénégal | WFP | +221 77 413 30 37 |
| 18 | SAMASSE Kaboro | Mali | IPR/IFRA | +223 76 15 12 81 |
| 19 | SANOGO Souleymane | Burkina Faso | BONI Nazi University | +226 70 52 26 43 |
| 20 | SANTI Saïdou | Burkina Faso | BONI Nazi University | +226 70 40 33 65 |
| 21 | ZANGUI Hamissou | Niger | UAM | +227 96 68 47 48 |